Cognex [NASDAQ:CGNX]: Economic Valuation of A Robotics Company
2012/12/15 Leave a comment
I prepared this valuation for Prof. Joel Stern.
If you would like to see a chart or table with a white background, click through it twice. Use the back button to return to the article.
Executive of Summary
Cognex is correctly valued in the market.

A diagram from a machine vision patent assigned to Cognex
Overview of Cognex
Cognex is a machine vision systems corporation—they focus on computers which can see—particularly in industrial automation applications. Originally an MIT spin-out, whose name stood for Cognition Experts, they are headquartered in Natick, Massachusetts—though one of their two main divisions is in the Bay Area like a respectable technology company should be. They have been public since 1989 and have been paying an extremely modest dividend since 2003.

Figure 1 – Source: Google Finance
As of close on December 7th, Cognex stock was trading at $36.62 a share with 42,961,000 shares outstanding and a market capitalization of $1.573 billion. Their revenues are well diversified with 66% coming from outside the United States and the top five customers only account for 7% of revenue. Like most robotics companies, Cognex has no debt and exhibits the cash anomaly of the knowledge economy. For tax reasons, Cognex is planning to pay a large 4th quarter dividend, but before paying the dividend, Cognex will have over $400 million in cash and securities on its balance sheet. Cognex’s non-financial, GAAP capital, net of operating liabilities was only about $200 million and of that $80 million was goodwill. Contrary to popular wisdom, it does not take a lot capital to build robots.
Cognex is a classic, mid-sized, public robotics company if there if ever was one. Financially, it looks very similar to other successful robotics companies like Brooks Automation (BRKS), iRobot (IRBT), Aerovironment (AVAV), and to a lesser extent Intuitive Surgical (ISRG)—although none of these companies are direct competitors.
Cognex has unique technologies, a portfolio of successful and related products, and a habit of expanding its business with both organic growth and prudent, related acquisitions. The macroeconomic trends of the coming decades probably favor Cognex. The growth of on-shoring, higher labor and environmental standards, rising third-world wages, continued growth of the global middle class, and the increased pace and automation of supply chains all favor the growth of Cognex’s business. There is some threat of emerging competition or economic disruption from start-up companies like ReThink Robotics, but Cognex’s cash and industry relationships make it equally likely that they are the distribution and exit strategy for such start-ups.
Valuation Process
The valuation process relies on data gathered from market reporting and the SEC’s EDGAR database. Historical returns allowed me to compute the cost of capital. Following this, I made adjustments to discover Cognex’s historical assets and economic returns to assets. I assumed that the 7 year historical return, approximately one economic cycle, would be a good guide to future returns as this is not Cognex’s first economic cycle. This means that we are assuming that Cognex returns 21.3% on its economic assets every year.
I used a somewhat roundabout way to get investment. First, I assumed that the GAAP assets required to produce these sales would remain unchanged and so depreciation would exactly equal GAAP investment. Compared to other robotics and tech companies Cognex has too many GAAP assets, see Figure 2. To estimate future R&D spending, I observed Cognex has been remarkably consistent in spending 14% of gross revenue on R&D, so I backed into gross revenue from the economic return on assets by assuming a fixed ratio from historical data. From there, I took 14% of gross revenue and added it to capitalized R&D. From this capitalized R&D figure, I removed 1/12 annually for obsolescence, to arrive at a capitalized R&D figure. This figure was added to GAAP non-financial assets to get the economic assets of the firm.

Reader, my apology for overuse of this chart
Figure 2 – Source: 2011/2012 10-Ks on EDGAR as of July 2012
From this forecast of the company growth, I used three valuation methods. First, I estimated a free cash flow, which is the economic return of the assets of the company less the addition to capitalized R&D. Because they have no debt and no GAAP investment beyond depreciation, this is equal to Cognex’s operating profit. Next, I calculated the economic value added, this is the spread on the total economic assets employed by the company in any given year. I calculated both of these methods for the next 20 years, with a perpetuity value beyond the forecast period. Finally, I calculated a long form economic value driver model of the firm. For this, I ran the calculation two ways. One way, the forecast period is 20 years, the other has an investment period of 10 years. The ten year period brought the value in line with the other methods. This may be a consequence of the way that I dealt with the changing investment amounts. However, the long form is mostly intended to talk about the sources of value in the stock price, not accurately predict what the price should be.
Cost of Capital
To estimate the cost of capital for Cognex, I regressed the monthly returns to Cognex over the ten year treasury return for the last five years against the equity premium of the Russell 3000. The result is below in table 1. The alpha is not significant—and even if it was, this alpha could not be expected to be permanent—however forcing it to zero does not yield a significantly different beta, so I used a beta of ~1.38.

Table 1 – Regression of Cognex Premium Returns to Russel 3000 Premium Returns
This beta times a future equity risk premium of 6% and on top of a ten year risk free rate of 1.626% results in cost of capital 9.89%. Since Cognex has no debt, this is the weighted average cost of capital as well. The ten year bond may not be a perfectly appropriate choice given our forecast period of twenty years, but it should be an adequate estimator for our purposes. Using the 30-year yield would raise the cost of capital by about 1% to be almost 11% instead of just under 10%. Given the economic spread that Cognex returns, this would change the valuation by about 10-15%, but it probably wouldn’t change many of the company’s investment decisions.
Free Cash Flow Valuation
Using the method above, I prepared a forecast of the free cash flows Cognex can be expected to produce. The table below shows the forecast with the intervening years truncated. Of course this forecast does not adequately capture the cyclicality of Cognex’s business selling industrial equipment. However, it gets very close to the share price in the market.

Table 2 – Free Cash Flow Valuation of Cognex [Entries 2018-2031 Omitted for Clarity]
Discounted Economic Value Added Valuation
R&D should be capitalized in the firm. This is the key asset which Cognex derives its revenues from. Robotics factories tend to be singularly unimpressive and largely undifferentiated affairs. The basis of the 21.3% return the Cognex has historically earned on its economic assets is largely the R&D. As pointed out above, Cognex is probably not very efficient at managing its real GAAP assets. My R&D capitalization schedule relies on assumptions, but I think reasonable ones based on my experience in the robotics industry. These assumptions, along with the spread on employed economic capital, drive the value in the discounted economic value added method. The spread that I used has to be pretty close to a fair estimate given the R&D depreciation method that I used, which assumes that R&D useful life is a random exponentially distributed variable with a mean of 12 years.

Table 3 – Discounted EVA Valuation of Cognex [Entries 2018-2031 Omitted for Clarity]
Long Form Economic Valuation
The long form model of the firm show in table 3 looks at the drivers of value. As investment is variable over the period, I used the starting value of economic investment to . This will likely understate the long form value of the firm slightly. However, the long form appears to overstate the value of the firm compared to the other methods. If an investment period of 10 years is used, the long form comes much more into harmony with current prices and the other methods.
 Table 4 – Long Form Valuation of Cognex
Conclusion
I’m not very enamored of public equity investing so I’m a little foggy on what the analyst terms mean. In recent periods it has seemed like analyst terms like, “strong buy” and “buy,” mean things quite contrary to their common meaning—perhaps closer to “Be careful” and “Call your broker with a sell order ASAP.” Going by conservative assumptions derived from historical data of the last economic cycle, I got prices that were very close to, and bracketed, the market price of the stock. Cognex would be reasonable to hold in a portfolio if you expect earn the market cost of capital on your portfolio. There is upside potential, but there are also risks the current price. All in all, it looks set to return the cost of capital for the foreseeable future.
There is power in being able to say what amount of economic capital you are employing—regardless of where the accountants hid it. It also allows you to look at any company like it is a bank. The firm takes in capital from whatever sources, and using it for purposes that earn a spread over the cost of capital, then returning the capital and pocketing the spread for the owners. This uniformity of treatment, really gets at the heart of what is creating value in the firm.
However, I’m not sure that any of the methods of valuation adequately speak to what the real risk of this company is—which is that it needs its research to match the needs of its customers. The dogs might not eat the dog food, or they might unexpectedly ask for seconds. These changes in customer demand are going drive immense fluctuations in all the assumptions that financial forecasts make. It is a messy and localized business, but fundamentally, this is what really creates the value. Just doing R&D is not going to necessarily create value, true of any asset, but the matching problems are much more severe in R&D and the rate of economic return incorporates a lot implicit assumptions about how management will make the assets perform.
Appendix
Data and Estimates
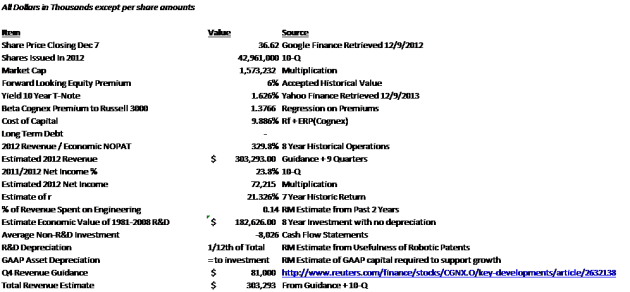
Table 5–Data and Estimates
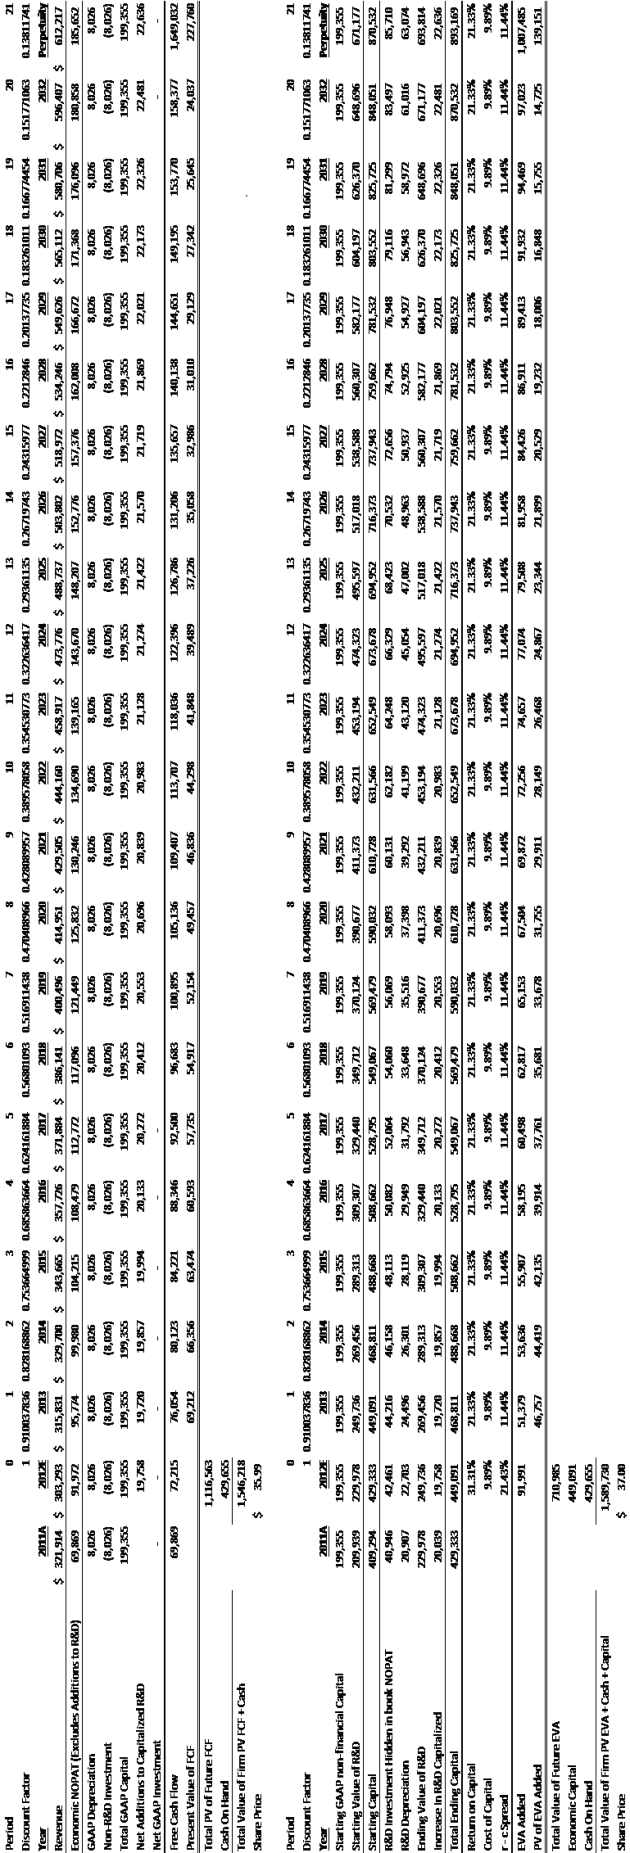
Table 6 — Printable Full Discount Calculations


East Coast Chauvinism in Robotics: Time to Face Facts, Silicon Valley is Kicking Our Ass
2012/06/24 by Robert Morris Leave a comment
A cleaned-up version of this article became my first post on Hizook. http://www.hizook.com/blog/2012/06/25/east-coast-chauvinism-robotics-time-face-facts-silicon-valley-kicking-our-butt#comment-971
_______
I have lots of love for Pittsburgh in particular, but it really pisses me off when people on the East Coast repeat a bunch of falsehoods (See #8) about how Boston and Pittsburgh compare to Silicon Valley and the rest of the world. Many people in Pittsburgh and Boston—including people I call friends and mentors—smugly think that the MIT and CMU centered robotics clusters are leading the world in robotics. This is demonstrably false.
If leadership in robotics means forming companies, making money, or employing people, then Silicon Valley is crushing everyone—no matter what the Wall Street Journal editorial page says about their business climate. I’ve previously published an analysis of the Hizook 2011 VC Funding in Robotics data that shows that the Valley gets 49% of total VC robotics investment worldwide.
I’d now like to add an analysis of U.S. public companies (see bottom of the page). Basically, the ‘Pittsburgh and Boston are the center of the robotics world’ story is even more ridiculous if you look at where public robotics companies are located. Silicon Valley is crushing the other clusters in the U.S. at creating value in robotics and in building a robotics workforce in public companies. (A forthcoming analysis will show that this true worldwide and if you include robotics divisions of public companies not principally engaged in robotics such as Boeing and Textron.)
77% of the workforce at public robotics pure plays is in Silicon Valley companies. An astounding 93% of the market capitalization is headquartered in Silicon Valley and even if you exclude Intuitive Surgical (NASDAQ:ISRG) as an outlier, the Silicon Valley cluster still has twice as much market capitalization as Boston.
The public companies that I deemed to meet the criteria of being principally engaged in robotics, that they had to make and sell a robot, and not have substantial value creating revenues from businesses not related to robotics are listed in the table below.
The one company that I believe might be controversial for being excluded from this list is Cognex (NASDAQ:CGNX). However, while trying to do decide on whether to include them, I found their list of locations. They have three locations in California including two in Silicon Valley. That means that this ‘Boston’ company has more offices in Silicon Valley than in Boston. I’m not an advanced (or motivated) enough analyst to find out what the exact employee breakdown is, but combined with the fact that they make vision systems and supply components rather than robots, I elected to exclude them. I acknowledge that a similar case could be made about Adept (NASDAQ:ADEP) that just made a New Hampshire acquisition, but I have decided to include them and count them towards Silicon Valley. I do not believe that either of these decisions, substantively impact my finding that Silicon Valley is the leading cluster when it comes to public company workforce and value creation.
I’m hoping the people who are spreading the misinformation that Silicon Valley has to catch-up to Boston and Pittsburgh will publish corrections. I believe that this is important, particularly because I want to see Pittsburgh reclaim its early lead in robotics. So many robotic inventions can trace their heritage back to Pittsburgh, it is a real shame that Pittsburgh has not used this strength to create the kind of robotics business ecosystem that one would hope.
It is impossible for communities to take appropriate action if they do not understand where they stand. I hope that this new data will inspire the Pittsburgh community to come together and address the challenges of culture, customer access, and capital availability that have been inhibiting the growth of Pittsburgh’s robotic ecosystem before they lose too many more aspiring young entrepreneurs—such as me—to the siren song of California.
1,100
463
20%
2%
183
43
3%
0%
768
577
14%
2%
174
135
3%
1%
1,924
21,840
36%
88%
619
606
12%
2%
429
1,110
8%
4%
171
13
3%
0%
5,368
24,787
100%
100%
Filed under Clusters, Commentary, Economics, Finance, Public Companies Tagged with Boston, business, California, Clusters, drones, economic, Equity, financing, hizook, market capitalization, New England, Public Securities, robotics, Silicon Valley, Stock, VC, Venture Capital, workforce